Let your coding agent draw.
AIGUI is an open-source plugin for Claude Code and Codex that lets the agent answer with pictures: charts, diagrams, maths, 3D scenes, molecules and infrastructure topologies whose steps play. It draws PNGs the agent checks, or opens a live page in your browser.
Claude Code
/plugin marketplace add liliang-cn/aigui
/plugin install aigui@aigui
Codex
codex plugin marketplace add liliang-cn/aigui
codex plugin add aigui@aigui
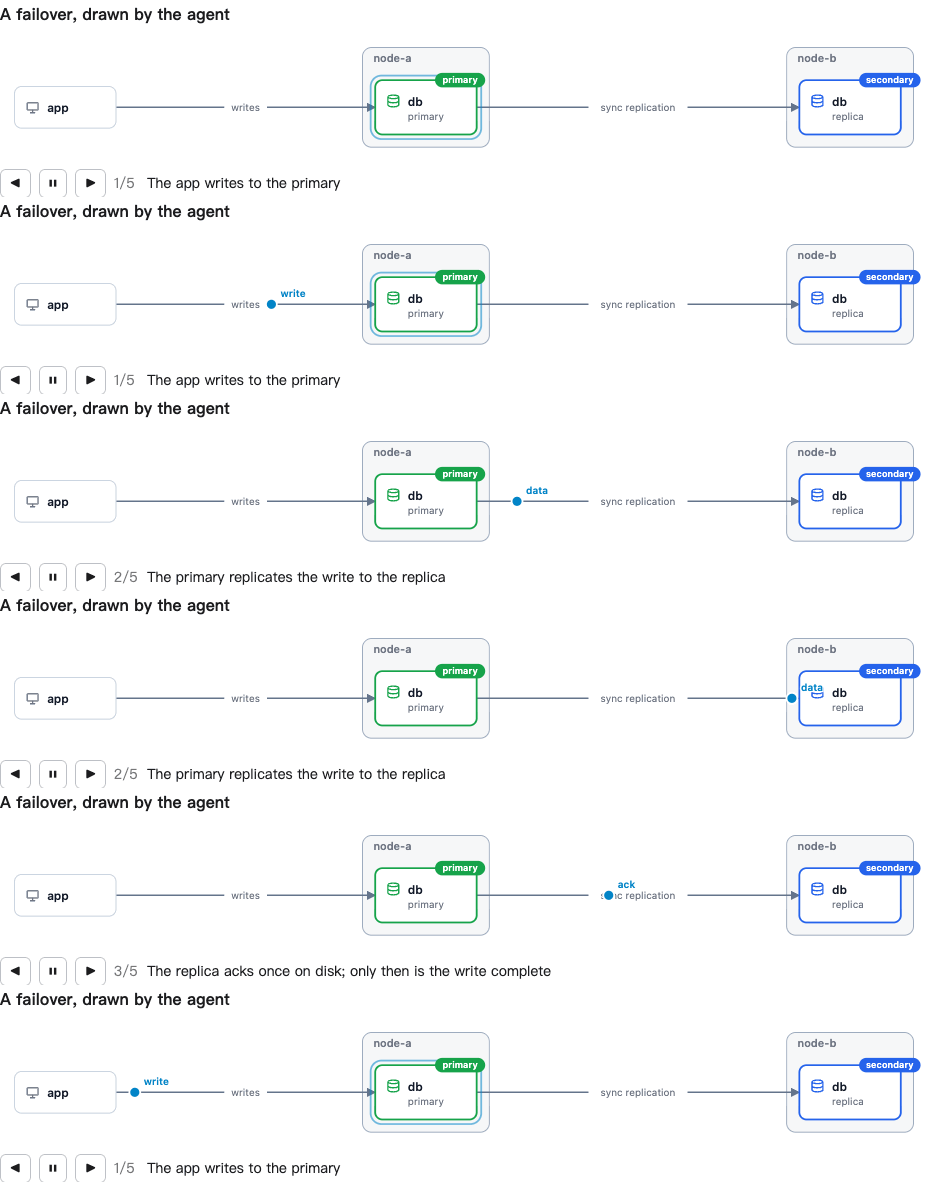
> How does failover work in this database setup?
● aigui_open — topology, 5 steps
Checked in a headless browser: no problems found.
The write reaches the primary, is copied to the replica, and the replica takes over when node-a fails. It is open in your browser, playing.
What it draws
21 block types, 9 of which render straight to PNG. Every picture below was drawn by AIGUI from a block a model wrote; each opens as an interactive page you can turn, hover and play. The data in them is sample data.
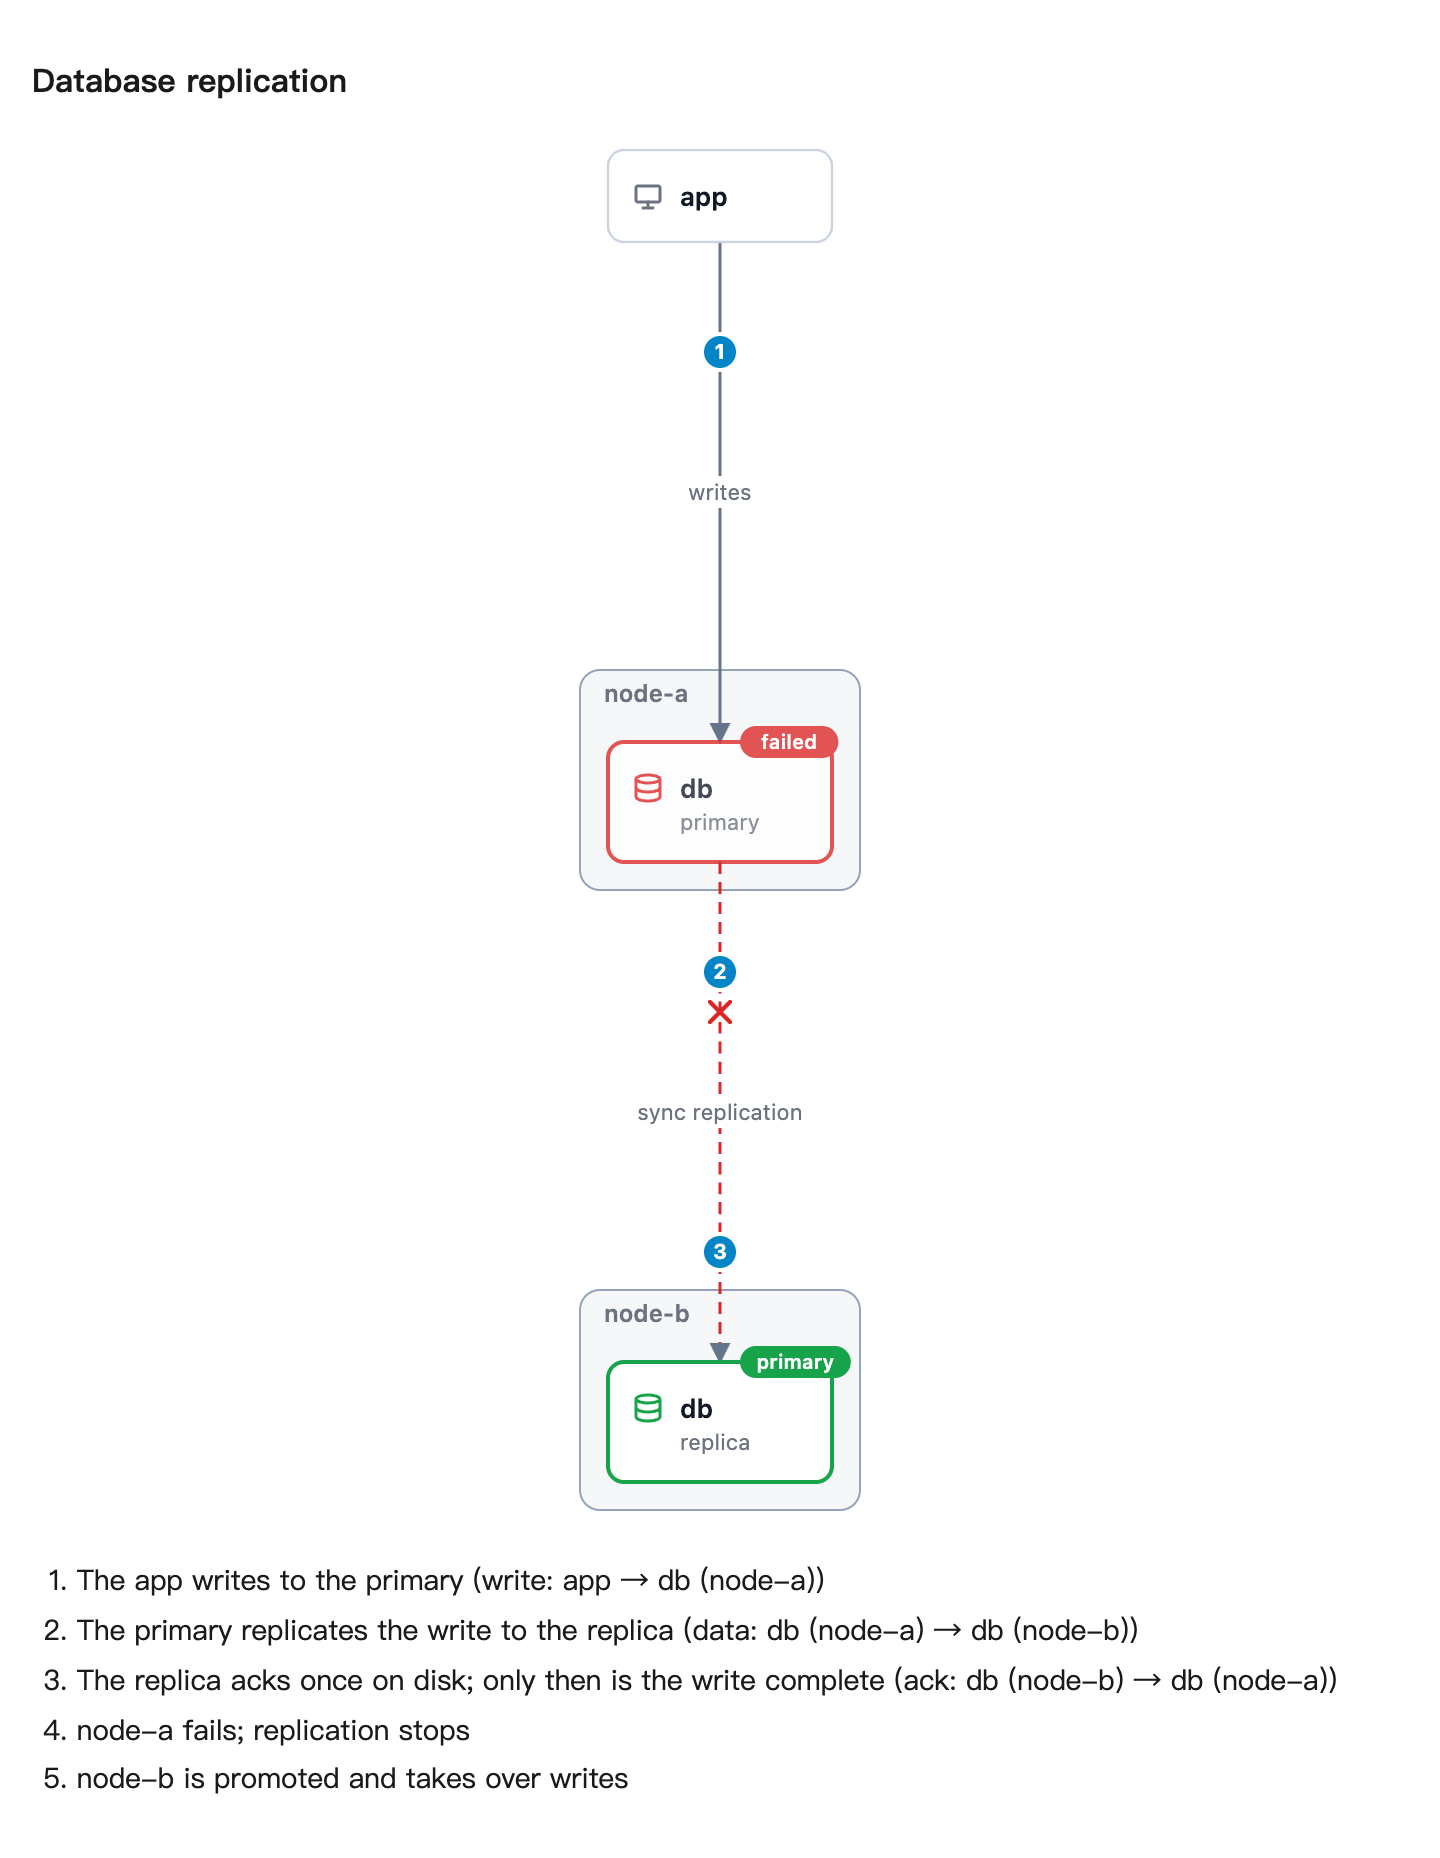
Topologies that play
Nodes, hosts and links laid out for you; steps move messages and change states.
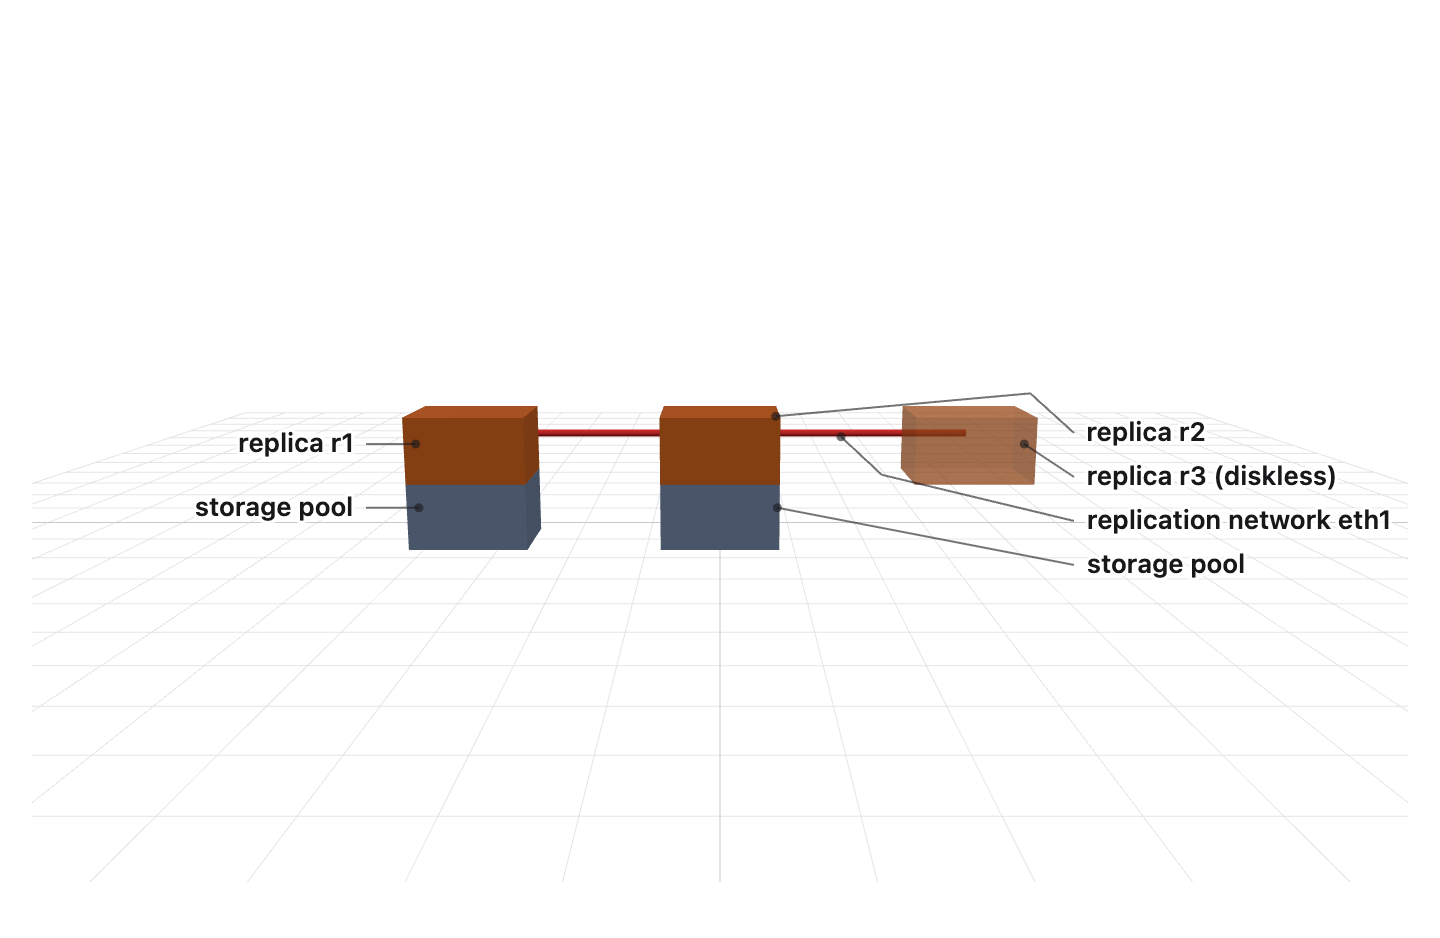
3D scenes
Boxes, cylinders and models placed in metres; labels kept clear of each other.
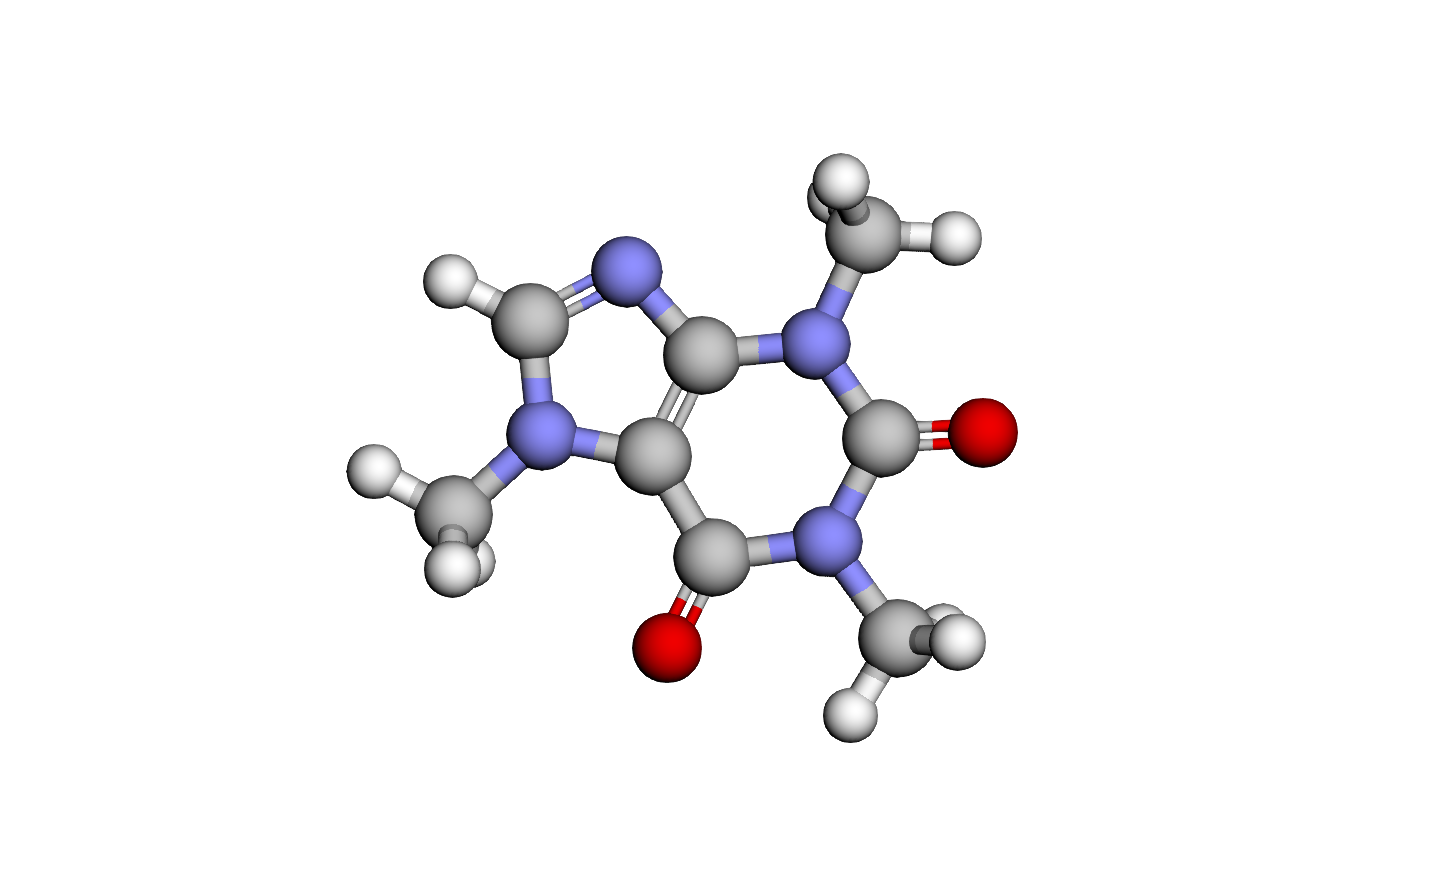
Molecules
From a SMILES string, relaxed with a force field, turnable in 3D.
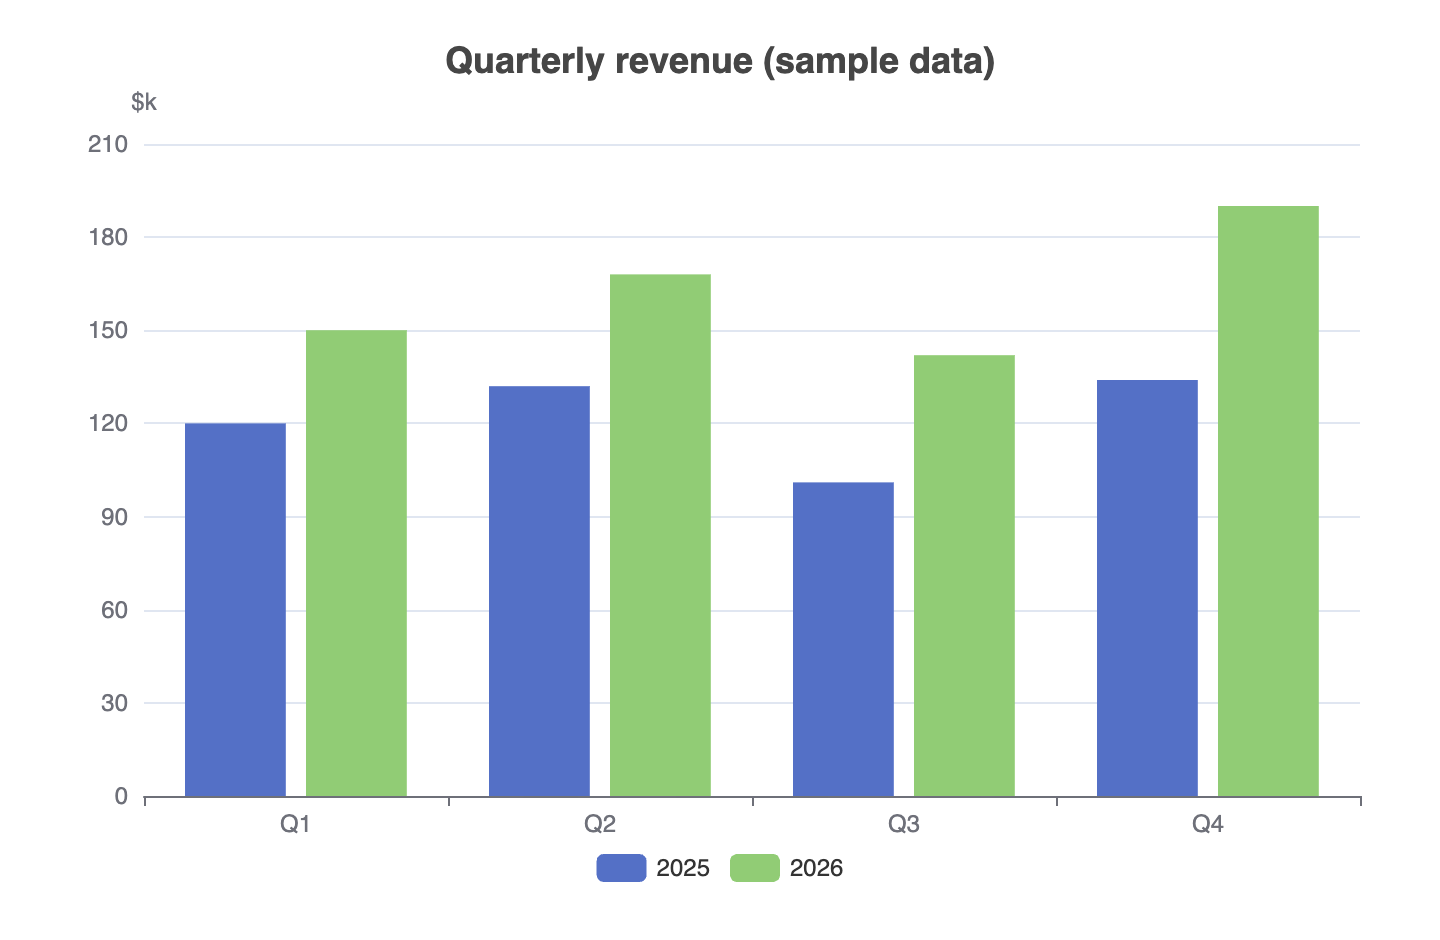
Charts, diagrams, maths
Any ECharts chart, Mermaid diagrams and KaTeX, in one page.
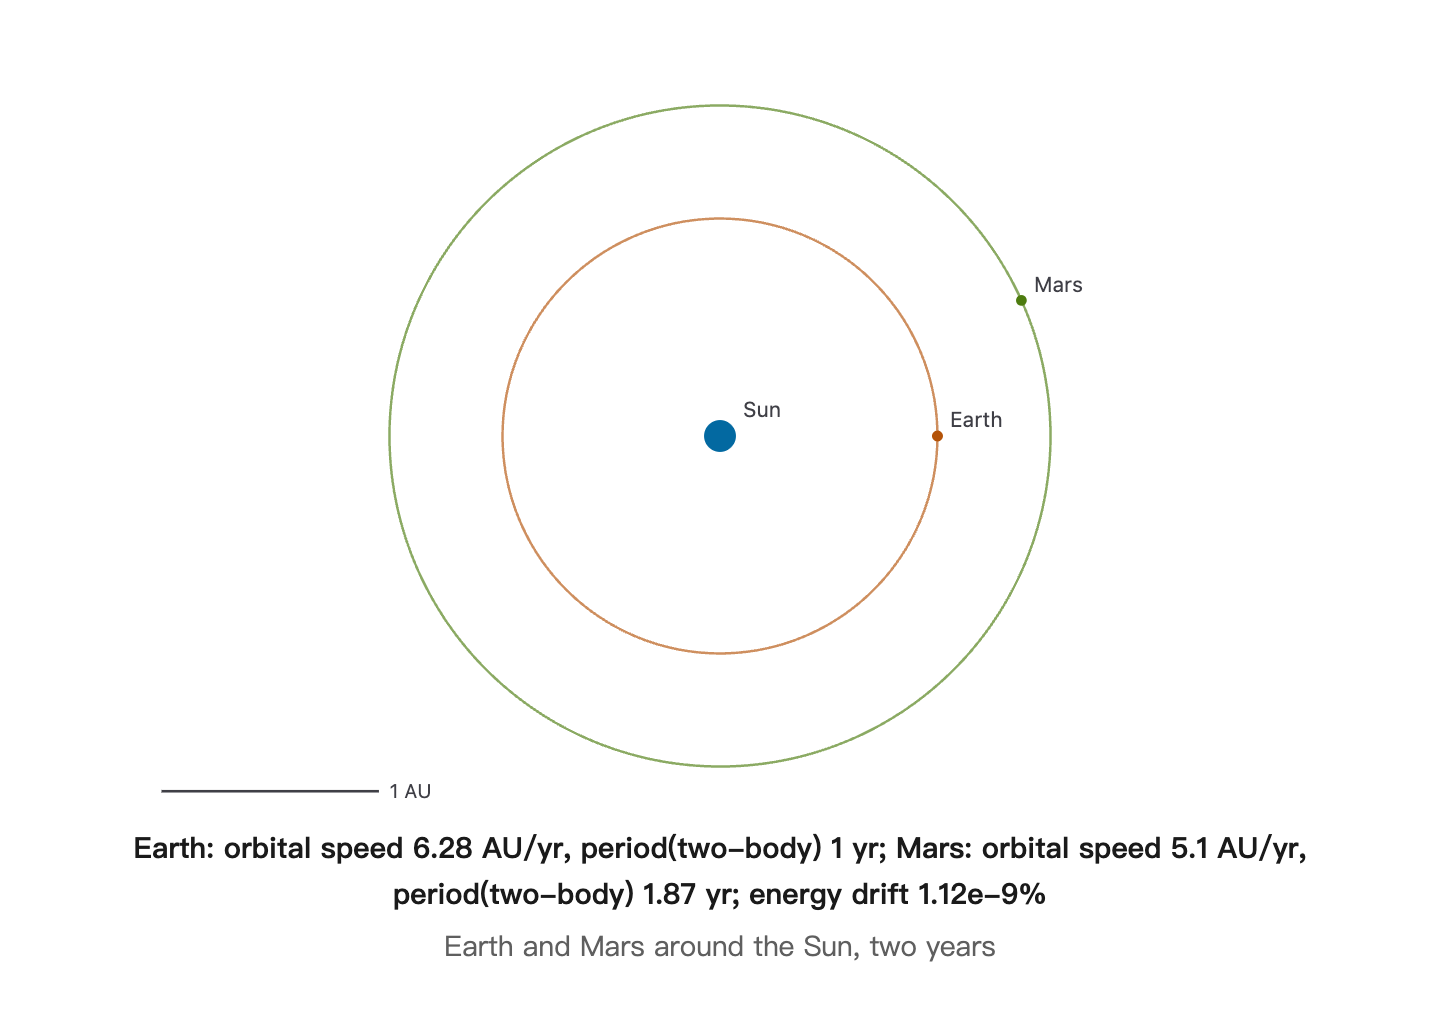
Orbits and collisions
Integrated from masses and distances, not hand-drawn ellipses.
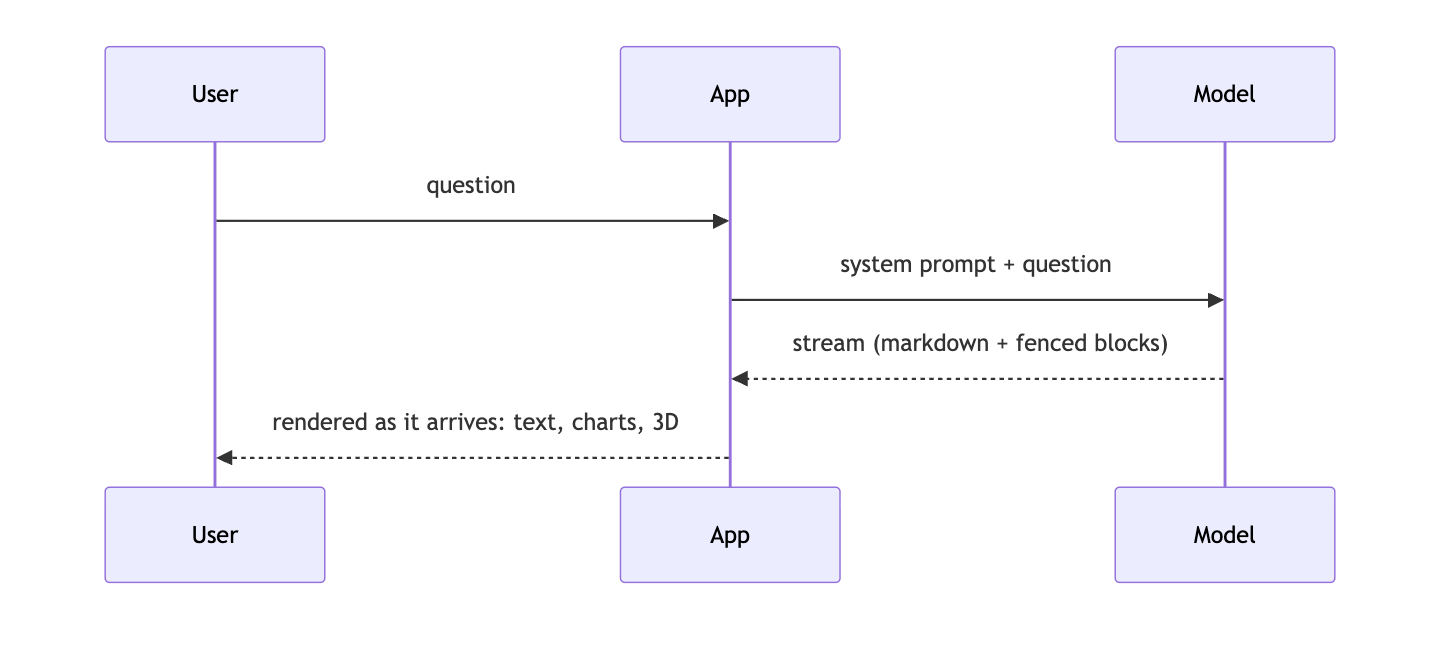
Diagrams
Flowcharts, sequences, state machines and class diagrams via Mermaid.
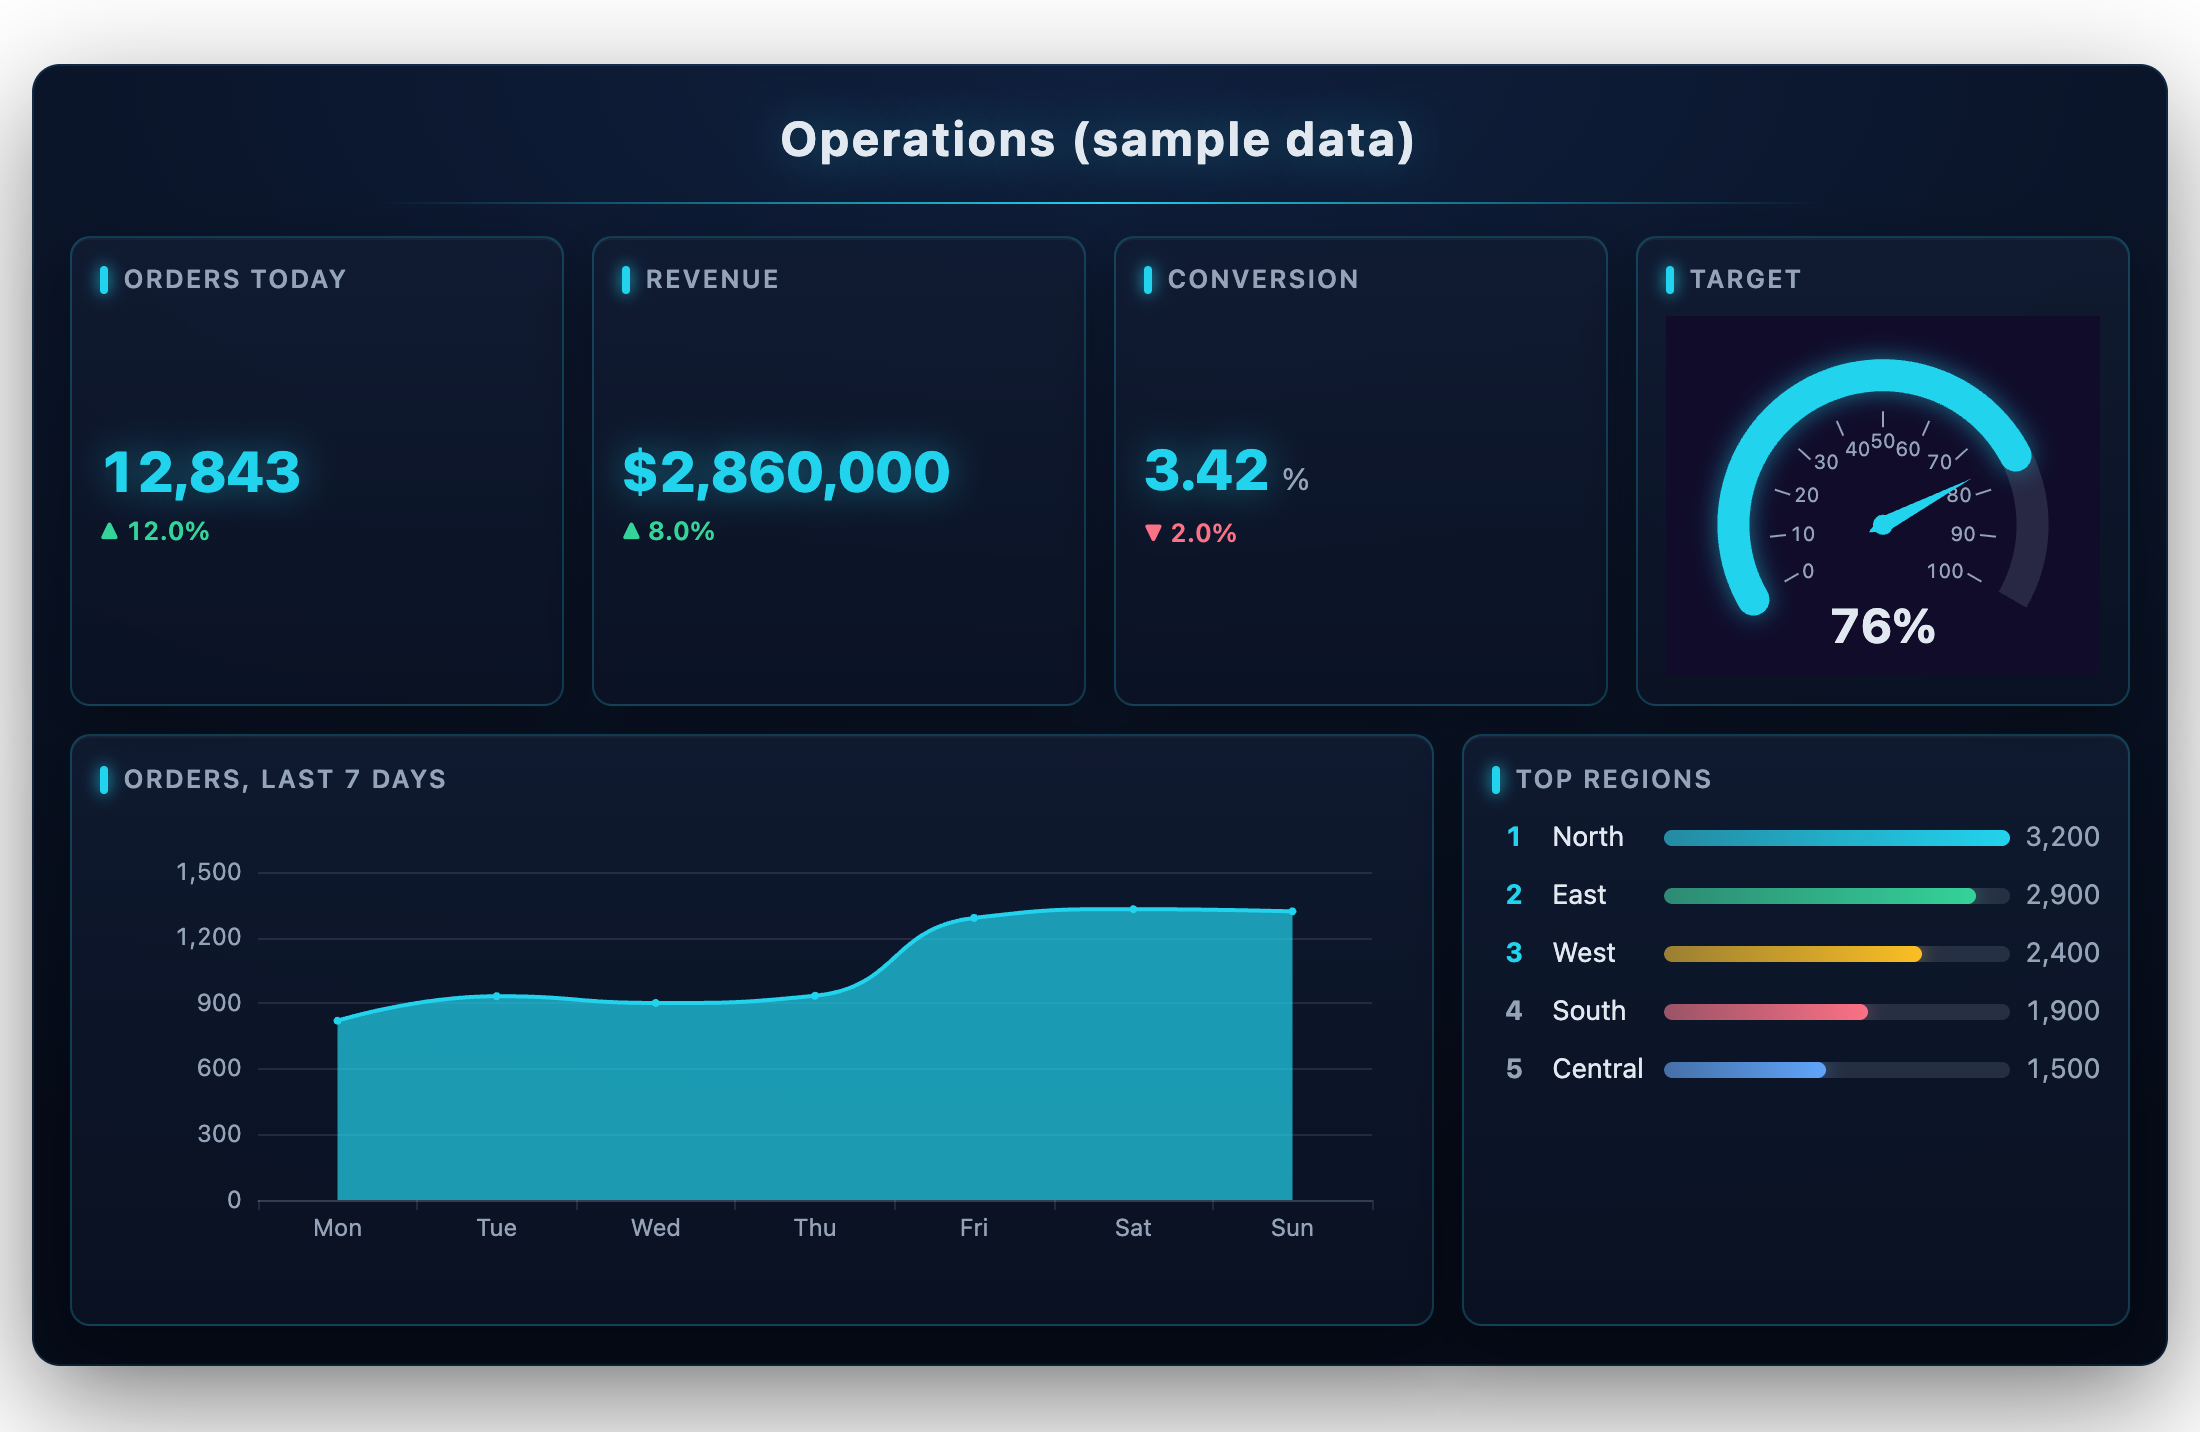
Dashboards
KPIs, gauges, rankings and charts on one wall, counting up as they appear.
How it works
The agent never writes drawing code. It writes a small block that states what to show, and AIGUI computes the rest — the layout, the 3D structure, the orbit.
You ask
A question whose answer is a trend, a system or a process.
The agent writes a block
JSON or Mermaid inside ordinary markdown, after reading the syntax with
aigui_guide.AIGUI draws and checks it
In a headless browser, looking for overlapping, clipped or unreadable labels.
You see it
As a PNG in your image viewer, or a live page you can comment on and export.
Built to be trusted
A picture looks like evidence, so AIGUI is careful about what goes into one.
Numbers come from your files
Pass a CSV, TSV or JSON file and reference it in the chart — {"$data":"sales","column":"revenue"}. The server fills in the figures and names the file behind each chart, so the model never retypes a number.
It checks its own pictures
Before the agent shows you anything, a headless browser looks for labels drawn on top of each other, text cut off or under 9 pixels, poor contrast and crowded charts, and the agent is told to fix them.
Topologies from real config
Point aigui_topology at a docker-compose file or a folder of Kubernetes manifests and it draws the services, databases, Services, Ingresses and volumes that are actually there.
Pages you can keep
Every page is listed in one index. Export any of them as PNG, PDF, a single self-contained HTML file that opens offline, or a GIF of its steps playing. Leave a comment on a block and the agent reads it with aigui_feedback.
Local and free
MIT licensed, no account, no API key. Drawing happens in a headless browser on your machine; pictures and pages are saved under ~/.cache/aigui.
Also an SDK
The same renderer turns a streaming LLM response into live UI in React, Vue or plain DOM. Over 2,000 automated tests and real-browser checks run on every release.
AIGUI compared
What a coding agent can show you with each approach.
| AIGUI | A chart MCP server | Mermaid in chat | |
|---|---|---|---|
| Charts | Yes, including 3D | Yes | No |
| Flow and sequence diagrams | Yes | Usually not | Yes |
| 3D scenes, molecules, orbits | Yes | No | No |
| Topologies with playable steps | Yes | No | Static only |
| Numbers read from your files | Yes | Varies | No |
| Drawing checked before it is shown | Yes | No | No |
| Export PNG, PDF, HTML, GIF | All four | Usually PNG | Depends on client |
Questions
What is AIGUI?
AIGUI is an open-source plugin for Claude Code and Codex, and an MCP server for any other MCP client, that lets a coding agent answer with pictures. It draws charts, diagrams, maths, 3D scenes, molecules, orbits, dashboards and infrastructure topologies, either as PNG images the agent can check or as a live page in your browser.
How do I install AIGUI in Claude Code?
Run /plugin marketplace add liliang-cn/aigui, then /plugin install aigui@aigui, and restart Claude Code. The first drawing installs the server from npm and a headless browser, which takes about a minute once; later sessions start in under a second.
Does AIGUI work with Codex?
Yes. Run codex plugin marketplace add liliang-cn/aigui, then codex plugin add aigui@aigui. Codex and Claude Code use the same server and the same skills, so the drawing tools and the guidance the agent follows are identical in both.
Can AIGUI chart data from my CSV files?
Yes. The agent passes a CSV, TSV or JSON file by path and references it inside the chart, for example {"$data":"sales","column":"revenue"}. The server fills in the numbers from the file, so they are never retyped by the model, and the result names the file behind each chart.
What can AIGUI draw?
21 block types: ECharts charts including 3D, Mermaid diagrams, KaTeX maths, dashboards and data walls, 3D scenes, molecules from SMILES, orbits and collisions, infrastructure topologies with playable steps, knowledge graphs, geometry, function plots, optics, mechanics, labelled figures, candlesticks, tables, progress lists and cited sources.
Is AIGUI free?
Yes. AIGUI is MIT licensed, runs locally, needs no account or API key, and sends nothing to a server: the pictures are drawn in a headless browser on your own machine and saved under ~/.cache/aigui.
How is AIGUI different from a chart MCP server or Mermaid in chat?
A chart server draws charts and Mermaid draws flowcharts. AIGUI covers both plus 3D, molecules, physics and topologies whose steps play, fills charts from your files, checks each drawing for overlapping or clipped labels before the agent shows it, and exports pages as PDF, standalone HTML or GIF.
Can I use the AIGUI renderer in my own chat app?
Yes. The same renderer is a TypeScript SDK for React, Vue and plain DOM that turns a streaming LLM response into live UI as tokens arrive: markdown, charts, diagrams, maths and app-defined cards. Install @ai-gui/core with an adapter and the plugins you need.